

Why describe.concurrent Made My Vitest Suite Slower
The first result was the confusing one.
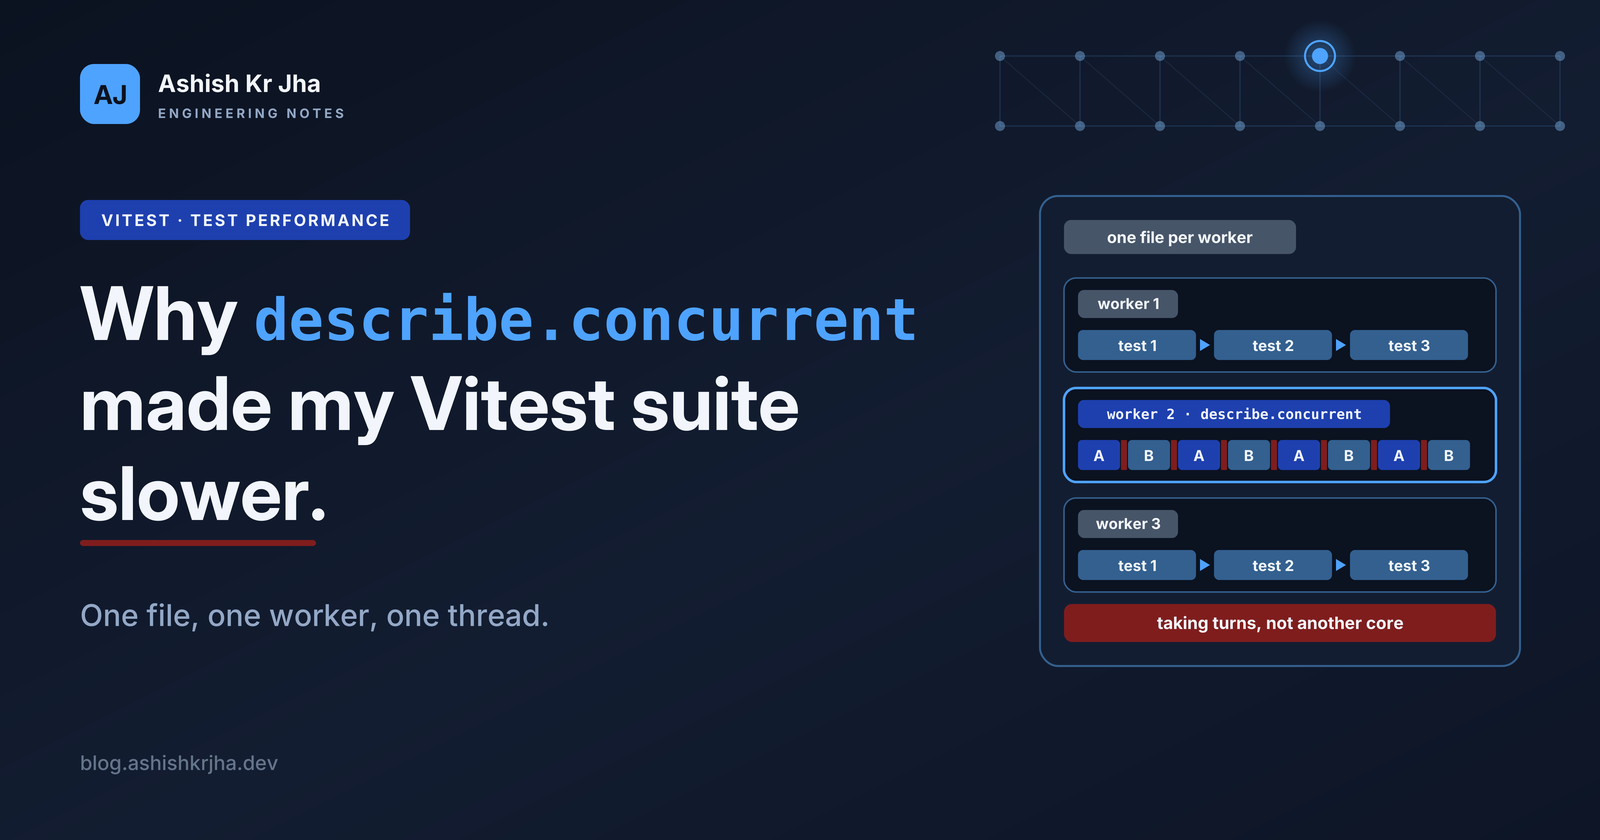
The slowest file in the suite was a browser test, and it was slow by a distance: five tests in a row, each booting a real Postgres and running real queries against it. The task was to make the suite run in parallel, and Vitest has a modifier that looks designed for exactly that. Put describe.concurrent on the block and the tests stop waiting for each other. I added it and ran the file. Noticeably faster, and green.
Then I ran the whole suite. It got slower, and most of that file's tests failed.
Both results were correct. The same one-line change made a file faster in isolation and made the suite slower and broken under load, and working out why turned into a fairly complete tour of how Vitest spreads work across CPU cores, and of the edge cases where the obvious tools stop helping. That is what this piece covers: which unit Vitest schedules, what concurrent does and does not do, why adding workers can change nothing, and a timeout that parallelism quietly breaks.
The mechanics here apply to Vitest and Jest suites generally. Where your setup differs, I will say how.
TL;DR
- Vitest and Jest schedule files, not tests.
concurrentinterleaves tests on the worker a file already has. It never adds a worker. - Interleaving helps work that waits. When the slow part of a test is computing, as it is with Postgres compiled to WebAssembly,
concurrentmakes things slower. - Tests inside one browser-mode file share an iframe, so concurrency within a file can pass alone and fail in a full run.
- If adding workers changes nothing, the scheduler was never the bottleneck.
- Splitting fat files by behaviour is what gave the runner something to parallelise, even though every file individually got slower.
- Parallelism stretches each test's wall-clock time, and a default timeout sized for unit tests will eventually notice.
What does Vitest schedule?
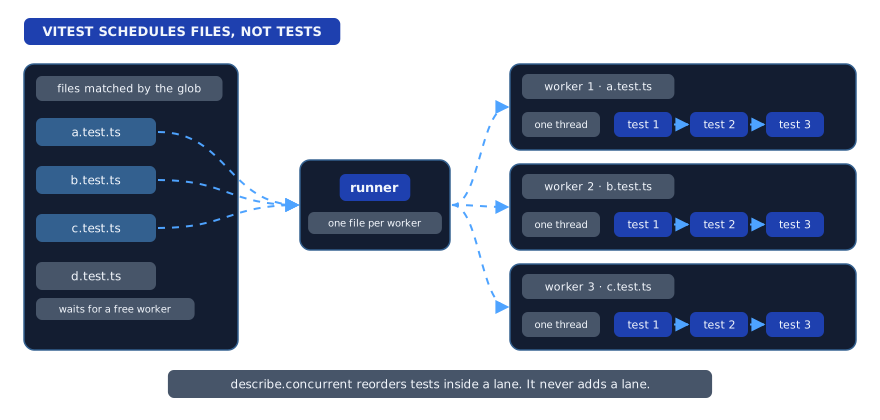
Vitest and Jest parallelise at file granularity. The runner collects the files matching a project's glob and hands them to a pool of workers, which might be child processes, worker threads or browser frames depending on your configuration. Each worker takes one file, runs it start to finish, and takes the next.
Two consequences follow, and both are easy to walk past.
The first is that a file is an indivisible block of wall time. However many cores are idle, the suite cannot finish faster than its slowest single file. If one file takes most of the clock, every other worker finishes early and waits.
The second is that tests inside a file run one after another by default, and marking them concurrent does not change how many workers you have. The Vitest documentation is explicit on this: concurrent tests all run in the same worker as the file they belong to. They get interleaved on that worker's single JavaScript thread.
That second point is the one that surprised me, because the name suggests otherwise. "Concurrent" sounds like "at the same time, on different cores". Inside a single file, it means "taking turns, on one core".
This is a property of these two runners rather than a law of testing. Playwright Test, under fullyParallel, does distribute individual tests from one file across workers. If that is your runner, the rest of this piece binds differently.
Is your slow work waiting, or computing?
Once concurrent is understood as taking turns on one thread, a single question decides whether it can help, and it is worth understanding why before looking at any test.
JavaScript runs one piece of code at a time on a thread. When a task hits something it has to wait for, a network response, a file read, a timer, it hands control back, and the event loop runs something else until the result arrives. That is where concurrency earns its keep. A thread that would otherwise sit idle during the wait gets useful work done instead.
When a task is computing, nothing hands control back. The thread is busy the whole time, so there is no idle gap for another task to slip into. Interleaving two computing tasks does not overlap them. It alternates between them, and the switching costs something.
A kitchen with one cook is a fair picture of it. If each dish spends most of its time in the oven, the cook can start the next one while the first bakes, and two orders finish much sooner than one after the other. If every dish is nothing but chopping, taking a second order means switching boards back and forth, and both dishes finish later than if the cook had just done them in turn.
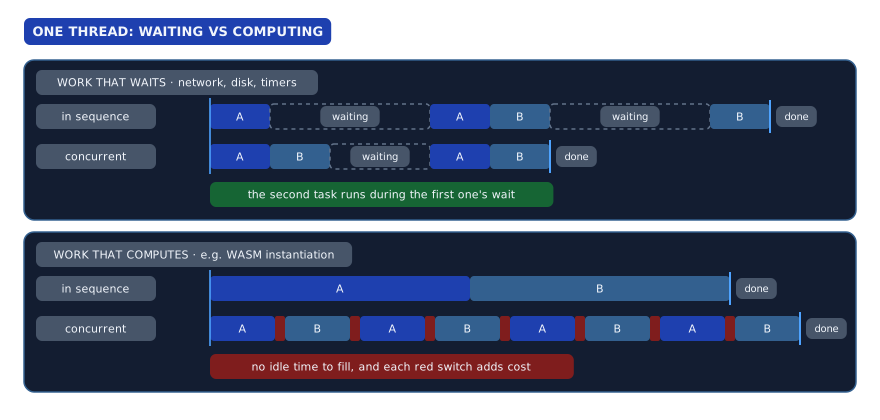
My suite runs the app against a real Postgres rather than mocks, using PGlite, which is Postgres compiled to WebAssembly. That is excellent for fidelity, since the tests exercise genuine SQL. The catch is that creating a database is single-threaded WASM instantiation. It is all chopping: pure computation on the one JavaScript thread, with no I/O to hide behind.
That is easy to reason about and easy to get wrong, so I checked it directly by creating a batch of databases one after another, and then the same batch with Promise.all. The "parallel" version was slower. There was no waiting to overlap, so it paid for the interleaving and got nothing back.
The edge case: green alone, red in the suite
Which brings back the opening puzzle. On its own, the concurrent file had the whole machine to itself and came out green. In the full run it shared the machine with everything else, and two separate mechanisms surfaced.
The first is documented behaviour, and Vitest names it in the error it raises when a concurrent test tries to take a screenshot: concurrent tests in the same file run in the same iframe and affect each other's environment. That is a statement about tests inside one file. Separate files get separate frames, which becomes the whole solution a couple of sections from now.
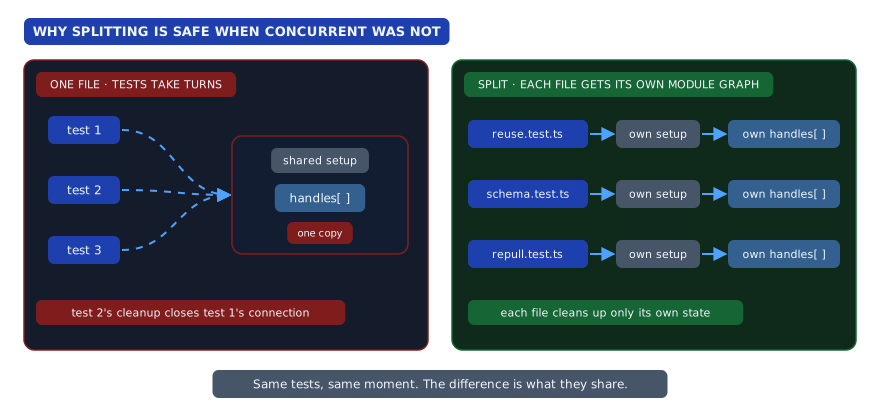
The second was in the file itself. It kept one array of open database handles, shared by all five tests and cleaned up in a hook. In sequence, that is harmless, because each test finishes before the next one starts. Interleaved, sibling tests were closing connections the others were still using.
This is the most useful edge case in the whole exercise, because the check you naturally run while working on a file, running that file, is precisely the one that hides it. Concurrency bugs inside a file need contention to show up, and a single file on an idle machine has none. It passes the check you run and fails the one you do not.
Why did more workers change nothing?
With concurrent ruled out, I worked through the configuration options people usually reach for when a suite is slow. Each is a sensible recommendation. On this workload, none of them helped.
Raising the worker count did nothing, and raising it further made the browser tier slower. Lowering it did nothing either. That pattern carries a lot of information on its own. When more workers make no difference, the scheduler was never the bottleneck. The workload is bound by a resource, here the CPU and the browser, and extra workers only add more contenders for the same thing.
Turning off isolation made the unit tier slower as well, and in hindsight it was a poor trade even before timing it, because per-file isolation turns out to be the thing that makes the eventual fix safe. Switching the pool from processes to threads made it slower too. That one changes what kind of worker runs the code, not how much computing the code does, and the computing was the constraint.
The last option is worth knowing about on its own. Configuring two browser instances does not split the tests between them. It runs all of them twice.
More files, not more concurrency
If the runner schedules files, the remaining lever is to give it more files.
Both tiers of the suite had the same shape: one fat file owning most of the clock while the other workers sat idle. So the slow files were split by behaviour, one concern per file, with the shared setup moved into a plain module beside them. That module is deliberately not named *.test.ts, so the runner does not collect it as a suite of its own.
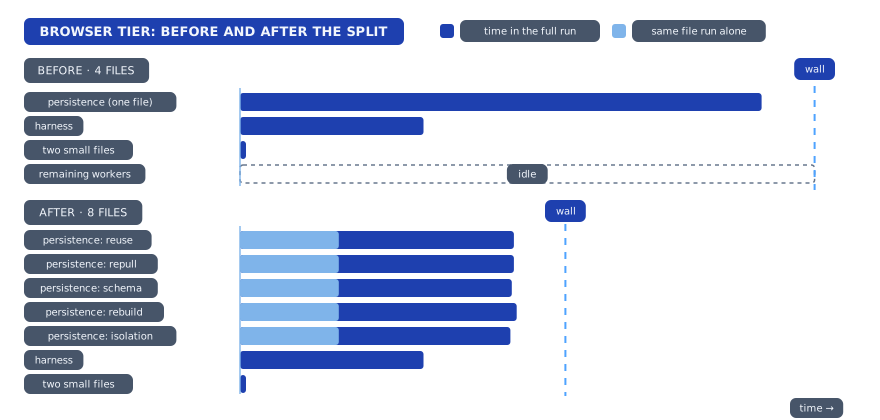
Here is the shape of the browser tier, before and after, on the same time axis:
The wall time is the longest bar in each block, and the second block's longest bar is a lot shorter than the first's. That improvement also settles a question about browser mode: separate files do run concurrently there. Had they been serialised into one frame, splitting would have changed nothing.
Why every file got slower
The second block hides a detail worth pausing on. The light segment at the start of each bar is how long that file takes run alone. Run together, each takes far longer.
None of the work got cheaper. It overlapped, and contention for the browser and the CPU took back a large share of what the overlap gave. That is the normal shape of a parallelism win, and it is why the arithmetic never reaches the number you would sketch on a whiteboard. Five files that each take a certain time alone do not finish together in that same time. They finish later, just not five times later.
Why is splitting safe when concurrent was not?
Both approaches run the same five tests at the same moment. One broke and one did not, and the difference is Vitest's default isolation.
Each test file gets a fresh module graph. When five files import the same shared setup module, each gets its own instance of it, module-level variables included. So every file can carry a plain cleanup hook that only ever tears down its own resources. The shared array of database handles still exists, in a sense, but there are now five of them and none of them is shared.
The split turned shared mutable state inside one file into separate state per file, and let the runner's isolation do the rest. When a concurrency problem comes from shared state, removing the sharing is usually simpler than protecting it. No locks, no careful ordering, no reasoning about which test closes what. Each file owns its own mess.
The timeout that parallelism breaks
Looking closely at per-test timings surfaced something unrelated to speed, and it may be the most transferable idea here.
The browser project was the only one without an explicit timeout, so it inherited the runner's default of five seconds. Its slowest test sat just around that line. Alone, it came in under. In a full run it sometimes did not. The other tiers set their own, much longer timeouts, so the browser tier's default was an omission rather than a choice. It presented as ordinary flakiness, the kind that makes you re-run CI and move on. Setting an explicit timeout made it go away.
The mechanism generalises. Default timeouts are sized for unit tests that take milliseconds. Any tier that boots real infrastructure, whether a database, a browser or a container, needs its own, set explicitly. And parallelism makes each test take longer in wall-clock time while doing identical work, exactly as the files in the previous section did. A suite comfortably inside its timeouts can start failing precisely when you make it faster, which is a deeply unfair outcome for having done the right thing.
Where one machine runs out
The tiers each got clearly faster, and those are the commands a developer feels, run many times a day. The whole suite improved much less, and the reason is a ceiling rather than a flaw in the technique.
The two tiers run concurrently with each other, and together they already saturate every core on the machine. Before the split, one fat file held a core while others idled. After it, nothing idles. Once that is true, rearranging work between files cannot find capacity that does not exist.
Two further limits show up at that point. Splitting has a cost of its own: every file pays its own transform and module-load time, so more files means more of that overhead, and it eats into the gain. A different pool strategy recovers a good share of it, which makes it a trade-off to tune rather than a tax to accept.
The browser tier also scales well short of linearly. Its files run concurrently, but they compete for the browser's resources and for the CPU, since the database work inside each is still single-threaded WebAssembly. Its floor is now one test that cannot be split any further, and it is also the tier that will grow fastest as more screens come under test. Past the point where every core is busy, the only thing that adds capacity is another machine, which means sharding across CI runners rather than more configuration.
Start smaller than this
None of this needs a benchmark script. Your runner already reports how long each file took, and from that you can get three numbers.
Wall is what you wait for. Busy is every file's duration added together. Busy divided by wall is roughly how many cores you are using.
Now put your slowest single file next to the wall time. If that one file is most of the wall, splitting it is the whole job, and it might take an hour. If it is a small fraction, and busy divided by wall is already near your core count, you are saturated and splitting will buy very little. One number hides that answer. Three make it obvious.
Before reaching for concurrent, time your slow operation in sequence and with Promise.all. It takes a few minutes and tells you whether your tests are waiting or computing.
And do the timing on a quiet machine. A dev server, a container or a virtual machine running on the same cores will skew every comparison you make. Running the two variants alternately, a few times each, and comparing their best runs goes a long way.
What I got wrong
The biggest cost was never the scheduling. The task was framed as "make it parallel", and the suite was already parallel across files. The larger cost sits inside each browser test, which reseeds the entire seed corpus every time it runs. Making each test cheaper beats making tests overlap, because it helps on every machine, including the CI runner, and it does not run into the ceiling in the previous section. A profile before starting would have pointed there first. I accepted the framing because it was specific and sounded like the right problem, and "make it parallel" turned out to be a solution handed over in the shape of a problem.
What carries over
- Find out what your runner schedules. For Vitest and Jest it is the file, so wall time is at least your slowest single file.
- Classify the work before picking a tool. Concurrency helps work that waits. Parallelism helps work that computes.
concurrenton CPU-bound tests can make a suite slower while the code looks more parallel. - Treat "no effect from more workers" as a diagnosis. It means the bottleneck is a resource, not the scheduler.
- Test concurrency changes under load. A single file on an idle machine is the one setup guaranteed to hide the bug.
- Remove shared state rather than guarding it. File-level isolation hands you that for free if you split along it.
- Set timeouts per tier, explicitly. Parallelism stretches wall-clock time without changing the work, and defaults are sized for millisecond tests.
- Profile before accepting the framing. The cheapest test is faster than the best-scheduled one.
- One machine has a ceiling. Once every core is busy, capacity comes from another machine, not another flag.
I'm Ashish Kr Jha, a software engineer. I build things in production and then have to live with them, which is the part that actually teaches you something. More at ashishkrjha.dev.
Comments
Join the discussionNo comments yet. Be the first to comment.


